"We have two classes of forecasters: Those who don't know - and those who don't know they don't know"
We had 3 data releases out of the US yesterday. Snapshots
below:
1. Jobless Claims data – The week reflected annual revisions
to the seasonal adjustment factors
2. Retail Sales data – Retail Sales Control was flat mom following an upward revision of 10bps to prior month’s figure of -0.40%. The control group is all sales, excluding receipts from auto dealers, building-materials retailers, gas stations, office supply stores, mobile homes and tobacco stores that feeds into the GDP.
The Atlanta Fed GDPnow estimates Q1
GDP at 2.30% from prior 2.5%.
3. The most important print out yesterday was the PPI report
which stoked inflationary concerns after the strong CPI data. The rise in Core
Goods CPI was also seen in Goods PPI which rose a 1.21% mom and surge in Energy
which rose 4.35% mom.
The estimates of core PCE deflator following the
PPI report suggest Core PCE rose 0.30%. A reading of 0.30% will translate into
a 3.45% 3m annualized rate and 2.88% 6m Annualized rate which is the strongest since June of last year and Aug of last year respectively.
Alongside the strength in PPI prices which contributed to a
higher USD and a selloff in bonds, crude oil prices rose to a high of $
85.64 a barrel as IEA adjusted the global production outlook downwards and
demand growth upwards (for 2024 – demand growth @ 1.3 mbpd) on account of
disruptions in the Red Sea as many operators opt for the longer route between Europe
and Asia via the Cape of Good Hope. Read the earlier technical view on Crude here. Look at the strong correlation between the Crude Oil Prices and the US10Y yields below.

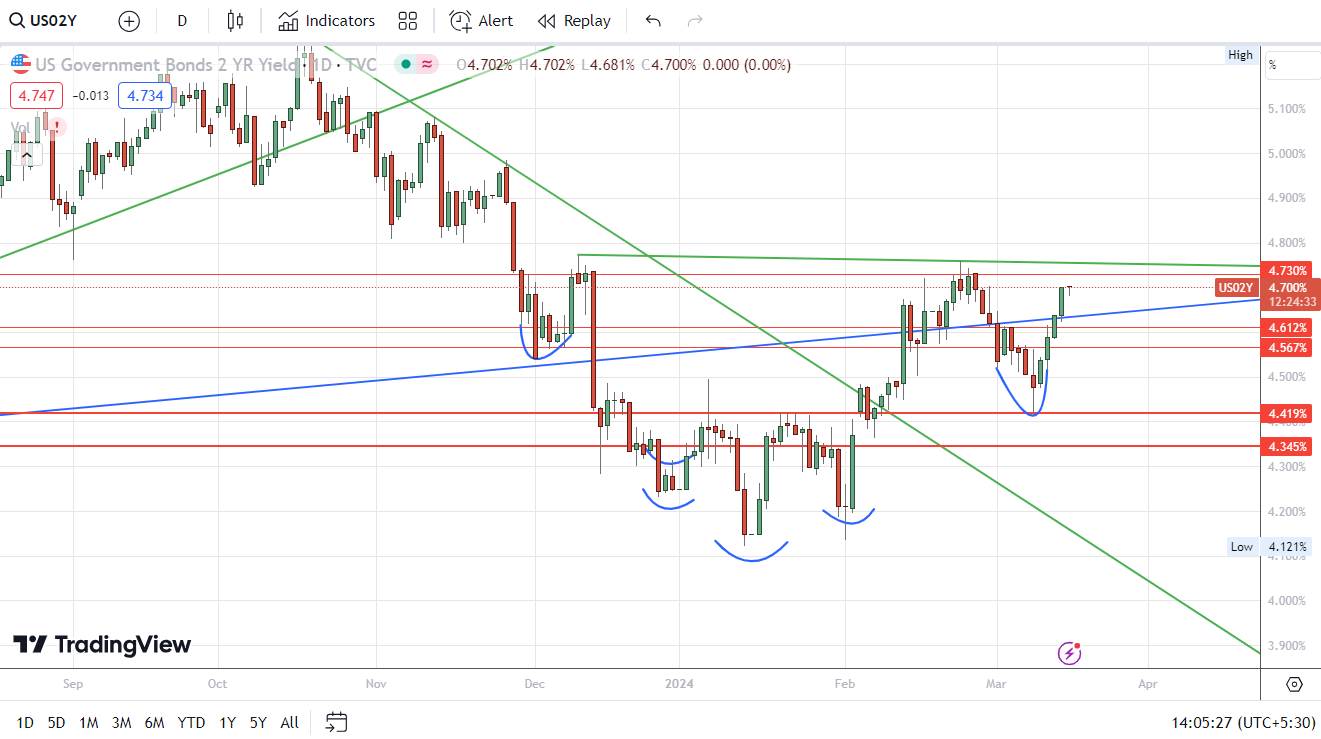
I'm looking at the US2Y and seeing a potential H&S pattern with key level being 4.75% and if the H&S target of Crude of $ 96 a barrel is any guide , higher yields could be in play.
The Implied FFR pricing shows 78 bps of rate cuts prices into 2024 with 18 bps of rate cuts priced into the June Policy. US2s10s bear steepened.
Guess we wait for next week's FOMC statement and most importantly Summary of Economic Projections to give more direction on the path of USD rates and BoJ rate decision.
|
Jobless Claims |
IJC |
CJB |
4W MA CJB |
|
Recent Print |
2,09,000 |
18,11,000 |
17,99,250 |
|
L-1 Print |
2,10,000 |
17,94,000 |
17,97,250
|
|
WoW Change |
-1,000 |
17,000 |
2,000 |
|
(in $ mn) |
Recent Print |
YoY▲ |
Mom ▲ |
Prior Month |
YoY▲ |
Mom ▲ |
|
Advance Retail Sales |
700727 |
1.86% |
0.58% |
696710 |
0.13% |
-1.05% |
|
Real Retail & Trade Services Sales |
225275 |
-1.27% |
0.13% |
224974 |
-2.88% |
-1.35% |
|
PPI: Final Demand |
Current Print |
Yoy ▲ |
Mom ▲ |
Prior Month |
Yoy ▲ |
Mom ▲ |
|
Headline |
143.43 |
1.55% |
0.56% |
142.63 |
0.95% |
0.43% |
|
Less Food & Energy |
141.10 |
2.02% |
0.29% |
140.70 |
1.97% |
0.45% |
|
Less Food, Energy & Trade Services |
130.75 |
2.76% |
0.44% |
130.17 |
2.65% |
0.56% |
|
PPI: Services |
141.89 |
2.27% |
0.29% |
141.48 |
2.21% |
0.52% |
|
PPI: Goods |
144.39 |
0.25% |
1.21% |
142.67 |
-1.55% |
-0.12% |
|
PPI: Energy |
144.53 |
-3.81% |
4.35% |
138.50 |
-9.38% |
-1.14% |

Comments
Post a Comment